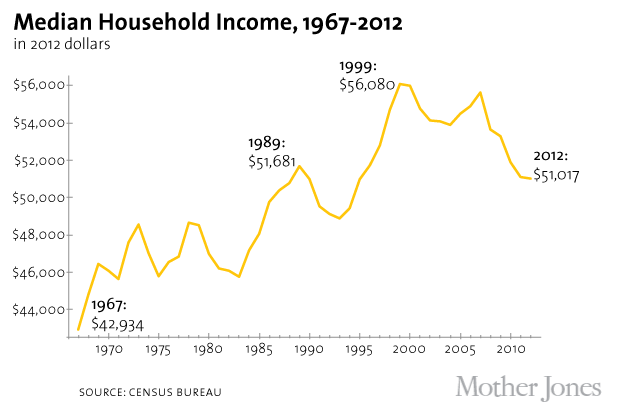
Yesterday the Census Bureau released its latest income data, confirming what millions of Americans already know: The recession may be over, but the recovery has yet to trickle down. Specifically, the Census reported that median household incomes didn’t budge between 2011 and 2012.
Digging deeper into the new data reveals more evidence of the widening income gap between the rich and the rest.
The only bright side of stalled incomes is that they are no longer experiencing the steep decline that started in 2007 before the recession hit. But that’s hardly cause for celebration: At $51,017, the real median household income in 2012 is even less than it was at the end of the ’80s, and it’s down 9 percent from its high in 1999.
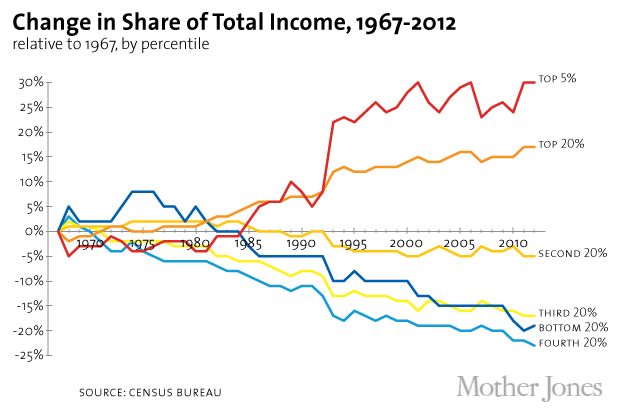
This loss of real income hasn’t affected all Americans equally. For the top 20 percent of earners, average incomes grew 70 percent since 1967, and they grew 88 percent for the top 5 percent. Meanwhile, middle-income households have seen their earnings grow just 20 percent in the past four decades.
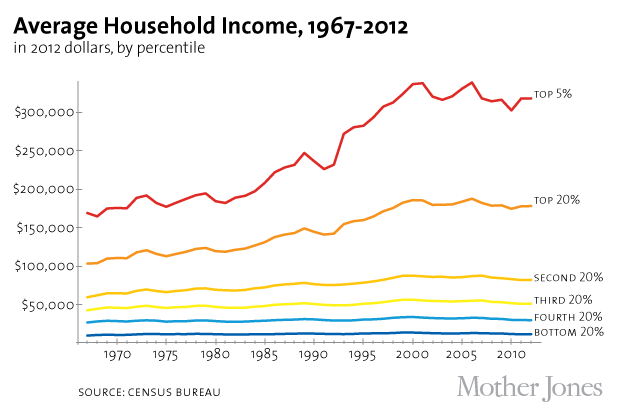
This translates into a greater share of total income going to top earners. In 2012, the top 20 percent took in more than half of all income in the United States, according to the Census.
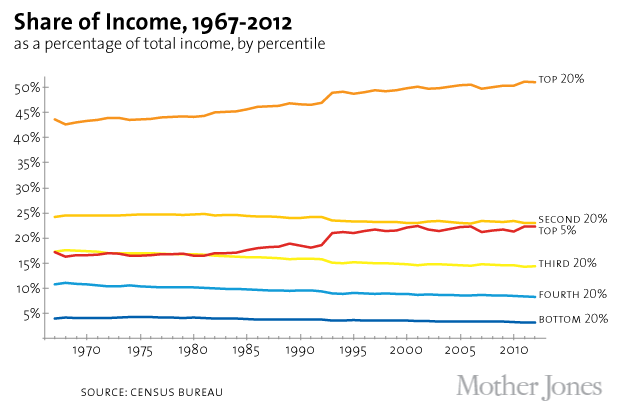
To put that into sharper focus, I’ve charted how each percentile’s share of total income has changed since the late ’60s. After experiencing significant growth in the mid-1970s, the bottom 20 percent of earners have seen their share steadily drop. Compare that with the top 5 and 20 percent, which have seen their piece of the pie expand in the past two decades while all other Americans’ shrunk.
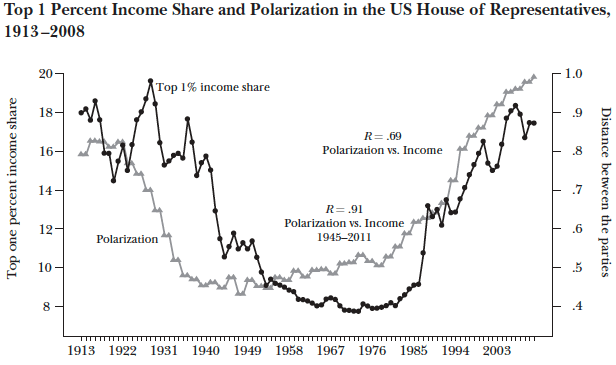
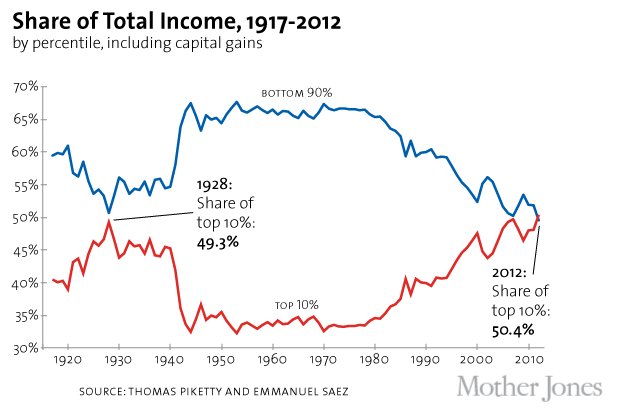
This trend is also seen in the latest income data complied by economists Thomas Piketty and Emmanuel Saez, which shows that the top 10 percent of earners now hold their largest share of total income since the eve of the Depression.
The new Census data on the bleak state of the American Dream came one day after Forbes released its latest list of 400 wealthiest Americans. Together, they are worth more than $2 trillion. The past year has been very good to them:
The average net worth of list members is a staggering $5 billion, $800 million more than a year ago and also a record. The minimum net worth needed to make the 400 list was $1.3 billion. The last time it was that high was in 2007 and 2008, before property and stock market values began sliding. Because the bar is so high, 61 American billionaires didn’t make the cut.
As Piketty and Saez report, 95 percent of all income growth between 2009 and 2012 went to the 1 percent.
Sources: Chart 1: Census Bureau, “Income, Poverty, and Health Insurance Coverage in the United States: 2012″ (PDF); charts 2-4: Census Bureau historical income data; chart 5: Emmanuel Saez, UC Berkeley (Excel)
Front page image: rangizzz/Shutterstock

