<a href="http://www.shutterstock.com/pic-184712681/stock-photo-contaminated-food-danger-concept-and-global-poverty-symbol-as-a-wet-ground-with-a-mud-puddle-of.html" target="_blank">Lightspring</a>/Shutterstock
Earlier this year, President Obama signed a bill into law that will essentially preserve the status quo of US agriculture for the next half decade. Known as the farm bill, the once-every-five-years legislation (among other things it does) shapes the basic incentive structure for the farmers who specialize in the big commodity crops: corn, soybeans, wheat, and rice. This year’s model, like the several before it, provides generous subsidies (mostly through cut-rate insurance) for all-out production of these crops (especially corn and soy), while also slashing already-underfunded programs that encourage farmers to protect soil and water.
As I put it in a post at the time, the legislation was simply not ready for climate change. How not ready? A just-released, wide-ranging new federal report called the National Climate Assessment has answers. A collaborative project led by 13 federal agencies and five years in the making, the assessment is available for browsing on a very user-friendly website. Here’s what I gleaned on the challenges to agriculture posed by climate change:
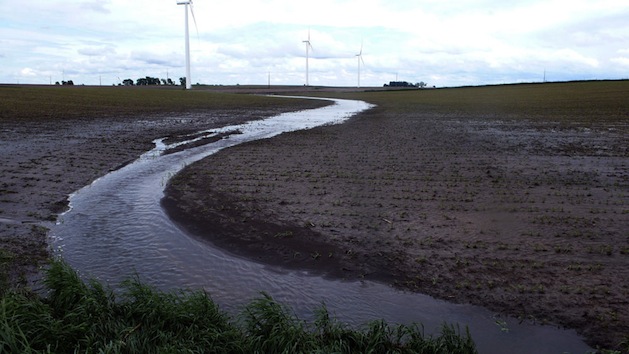
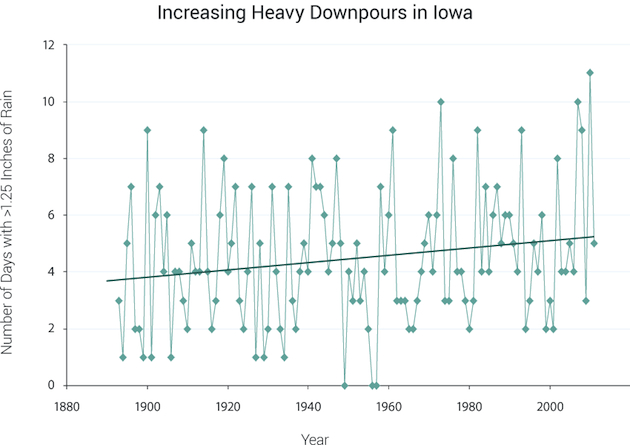
Iowa is hemorrhaging soil. A while back, I wrote about Iowa’s quiet soil crisis. When heavy rains strike bare corn and soy fields in the spring, huge amounts of topsoil wash away. Known as “gully erosion,” this kind of soil loss currently isn’t counted in the US Department of Agriculture’s rosy erosion numbers, which hold that Iowa’s soils are holding steady. But Richard Cruse, an agronomist and the director of Iowa State University’s Iowa Water Center, has found Iowa’s soils are currently disappearing at a rate as much as 16 times faster than the natural regeneration. According to the National Assessment, days of heavy rain have increased steadily in Iowa over the past two decades, and will continue doing so.
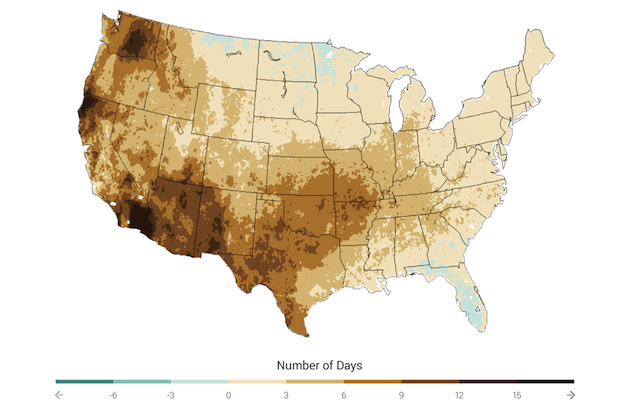
But dry spells are on the rise, too. In spring 2013, Iowa experienced its wettest spring ever, with storms that washed away titanic amounts of topsoil. The previous summer, it underwent its most severe drought in generations. Such gyrations can be expected to continue. This map shows the predicted increase in the maximum number of consecutive dry days, comparing the 1971-2000 period to projections for 2070-90. The worst-hit regions will be in the West—more on that below—but key corn-growing states like Illinois and Indiana take their lumps, too.
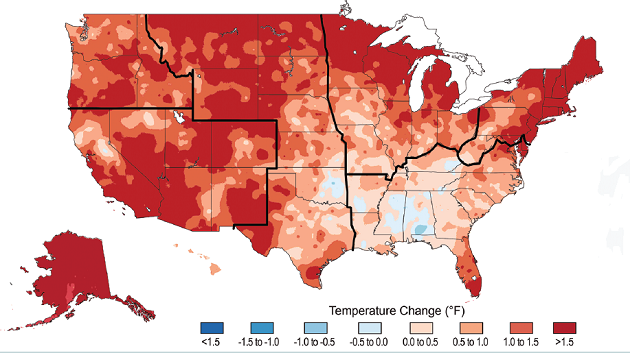
Crop yields will decline. All the carbon we’ve been spewing into the atmosphere over the past century and a half has so far probably helped crop yields—plants need freely available carbon dioxide, after all. But as the climate warms, that effect gets increasingly drowned out by heat stress, drought, and flood. And now, the Midwest is expected to see sharply higher average temperatures as well as days above 95 degrees Fahrenheit. This chart compares the region’s average temps in the 1971-2000 period to those expected between 2041 and 2070.

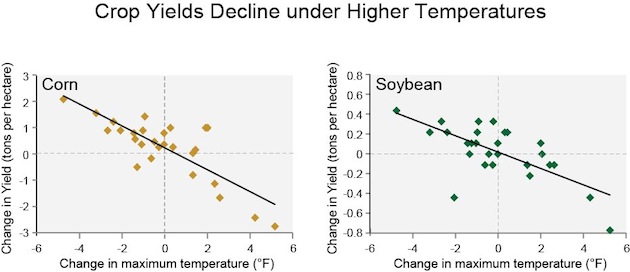
And higher temperatures correlate to reduced crop yields—as this chart, comparing yields and maximum temperature data in Illinois and Indiana between 1980 and 2007, shows.
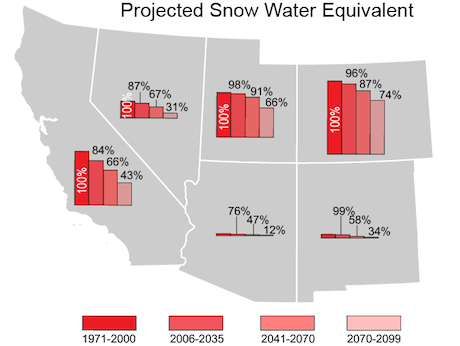
California, our vegetable basket, will be strapped for irrigation water. California is locked in a severe drought. I recently noted that farmers in the state’s main growing region, the Central Valley, are responding by rapidly drawing down underground water stores to keep their crops irrigated. The main driver: Farmers count on snow melt from the Sierra Nevada mountains to supply the state’s vast irrigation networks—and this year, the snows barely came. According to the report, as the weather warms up, they—and other farms in the Southwest—can expect much less snow going forward.
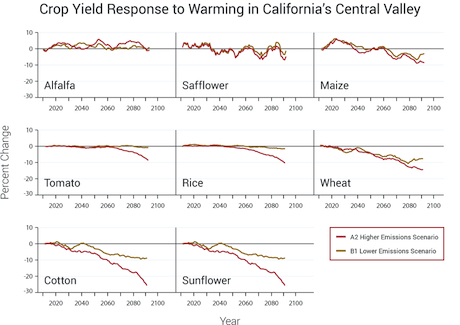
And even if they can get enough water, heat stress and other climate effects will likely knock down yields of some crops. Different crops respond to higher temperatures in different ways. This chart projects yields for Central Valley crops under two scenarios—one in which greenhouse gas emissions continue rising, the other if we manage to reduce emissions. Crucially, these projections are based on the assumption that “adequate water supplies (soil moisture)” will be maintained—a precarious assumption.
Wine grapes, nuts, and other perennial California crops will be hard-hit. In order to thrive, crops like fruit and nuts need a certain number of chilling hours each winter—that is, periods when temperatures range between 32°F and 50°F. Bad news: A warming climate means fewer cold snaps. The maps below show changes in chilling hours in the Central Valley in 1950, 2000, and a prediction for 2050 if current trends hold (the greener, the more chilling hours):
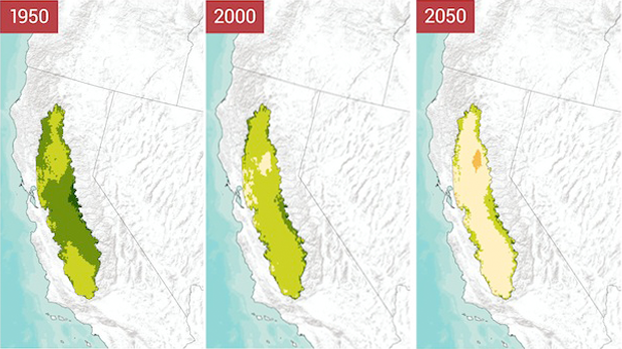
Overall, the report states, “the number of chilling hours is projected to decline by 30 percent to 60 percent by 2050 and by up to 80 percent by 2100.” Worse, the “area capable of consistently producing grapes required for the highest-quality wines is projected to decline by more than 50 percent by late this century.” It’s enough to make you want to uncork a bottle, while you still have a chance.

