<a href="http://www.shutterstock.com/pic.mhtml?id=64190743">Ulrich Mueller</a>/Shutterstock
“The fastest way to reduce solid waste volumes is to have a recession,” writes World Bank urban specialist Dan Hoornweg in a report on the state of trash in cities. Hoornweg elegantly sums up why garbage is and will remain a vexing problem. Here in the United States, we hear “zero waste” and think sanctimonious yuppies. Yet much of the world’s population is too poor to buy—and throw away—much stuff in the first place. But as developing countries become wealthier and adopt higher standards of living, they’re also following our wasteful lead.
Here are three key takeaways from the report:
1. The US has a big trash problem, but China’s will soon be even worse.
The World Bank report reveals stark but expected contrasts between rich, industrialized countries and those less well off. In the middle are emerging economies like China and Brazil, who are fast catching up in both wealth and waste. “Waste” in the World Bank report and this post refers to everything that makes it to a city’s dump, which includes recycling and compost before they get sorted out.
When it comes to the amount of trash per person, Americans and Europeans are the dubious winners. (A number of small countries like Trinidad and Tobago or Kuwait have eyebrow-raising per capita numbers too, but their populations are so small they have much less impact overall.) The World Bank report doesn’t mince words fingering the problem: “Solid waste is the most visible and pernicious by-product of a resource-intensive, consumer-based economic lifestyle.” As Mother Jones reported in 2009, Americans use 15 million sheets of paper every 5 minutes, 60,000 plastic bags every 5 seconds, and throw away “enough aluminum to rebuild our entire commercial air fleet every three months.”
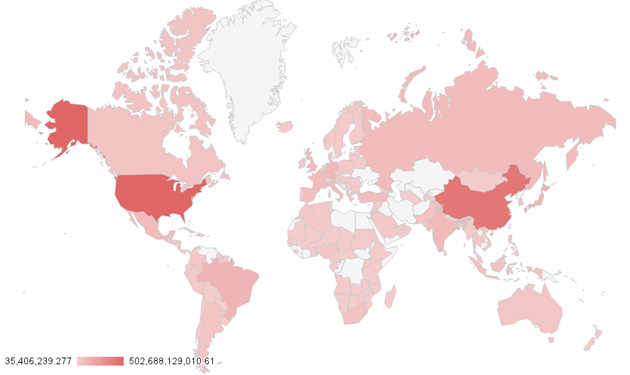
In this map of total trash generation, the US and China stand out as the biggest offenders. China still has a long way to go before catching up to American levels of per capita trash production, but its municipal waste problem is all the more critical with the skyrocketing population growth. In 2025, China will be producing 562 million tons of solid waste per year, according to World Bank estimates—almost three times the current output.
Current World Trash Generation (lbs./year)
Projected World Trash Generation, 2025 (lbs./year)
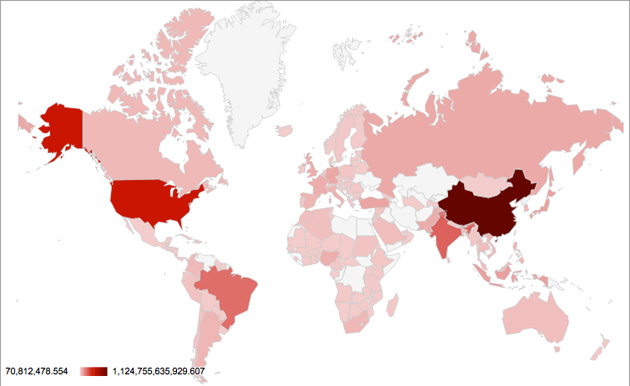
Given the links between wealth, waste, and population, it’s also interesting to look the relative proportions of each that these countries make up in the world. The United States creates disproportionately more trash than our share of people or wealth; then there’s an emerging economy like China, which generates an outsize amount of trash relative to its wealth but still less trash per person. That’s almost sure to change, though, as World Bank projections show.
2. Richer countries generate more paper waste.
You can tell an awful lot about a society’s wealth by looking at how much paper waste it produces. According to World Bank stats, trash composition varies dramatically across countries of different income levels. Poor countries have a very high proportion of organic waste such as food scraps or grass clippings. Paper, on the other hand, is the single largest component of waste in high-income countries; in the United States, one person generates 705 pounds of paper waste each year. According to an EPA report on trash in the US, one-third of that paper waste comes from the corrugated cardboard boxes in which nearly everything we buy gets packaged and shipped.
Notice that China is missing from this chart—its composition data is unavailable— and India’s proportion of “other” on its trash is unusually high, suggesting a different standard for sorting trash. (The percentage from Germany also doesn’t add up to 100, possibly due to rounding.)
Reliable trash data is not easy to come by as the World Bank report authors point out (PDF). The statistics in the report charts come from the most recent available year, which varies from country to country. (See the data sources yourself in Annex C of the report). The lack of robust, standardized trash data underscores how difficult it can be to hold countries accountable for trash generation.
3. Even if we recycled all of our trash, it wouldn’t be enough.
The good news is that a lot of that paper trash in the United States does get recycled: 62.5 percent of it. Overall, some 34 percent of our waste stream is diverted into recycling and composting, which is significant but falls short of the 86 percent that we could theoretically reach. In this bar chart of US trash composition, all organic waste is compostable and all plastic, metal, paper, and glass are recyclable—the only trash meant for the landfill is what’s left in “other” category, which includes ash, electronic waste, and old appliances. What’s striking is that if we just look at the “other” category—in other words, if we recycled and composted everything we theoretically could—Americans would still make more trash than the average person in India.
All of which echoes what several experts told Mother Jones in 2009: Recycling alone won’t solve our trash problem. (Don’t miss our special report on waste.) Remember the mantra “reduce, reuse, recycle”? Those first two strategies are important too, lest we end up shining cities on a hill of garbage.
Map and chart production by Jaeah Lee.
