
Get your news from a source that’s not owned and controlled by oligarchs. Sign up for the free Mother Jones Daily.
Via Jon Chait, the New York Times ran an interesting graphic this weekend showing demographic breakdowns of election results going back to 1982. Here it is for age groups:
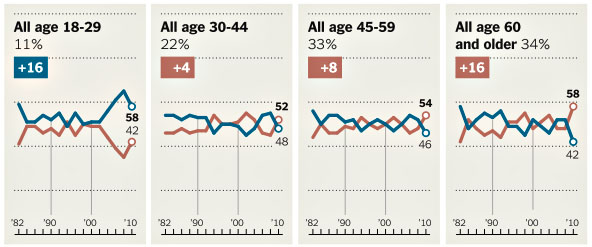
Basically, all age groups were relatively evenly split between Democrats and Republicans until 2004, when the youth vote started to blow out for Democrats, and 2010, when older voters went heavily for Republicans. That’s not quite what I would have expected, so this is a useful corrective. The other charts are interesting too.
NOTE: The NYT exit poll numbers don’t match the numbers at the CNN site, though they’re close. I’m not sure why this is. If anyone knows, enlighten us in comments.