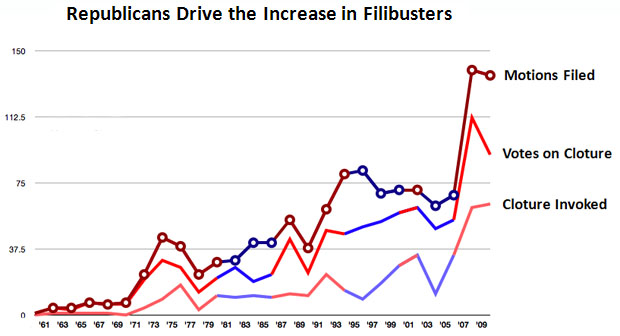
We haven’t had an excuse to talk about Republican abuse of the filibuster lately, so here’s a nice chart for you that spells it out. It comes from JS, a regular reader, and instead of just showing the rise in the filibuster over the past 50 years, it color codes each Senate session to represent the party in the minority. As you can see, Democrats have been responsible for only a tiny part of the increase. The big changes came in the early 70s, the late 80s, and then in the late aughts after Republicans lost the Senate in the 2006 elections. When you add up all the red segments, they represent virtually the entire increase in the use of the filibuster over the past half century.
This isn’t a big surprise or anything, but now you have the color-coded data to show to all your friends and relatives. Republicans are the party of obstruction, and they have been for more than four decades now.


