
As you know, I’ve spent a fair number of posts trying to persuade people that millennials don’t have it any harder than the generations before them. It’s really true, too. So here’s another bite at the apple.
This time I went to the Consumer Expenditure Survey from the Bureau of Labor Statistics. It’s exactly what you think it is: a survey that estimates how much people make and how much they spend. Here are the results for the most recent three generations, all of them at times when they were about 30 years old:¹
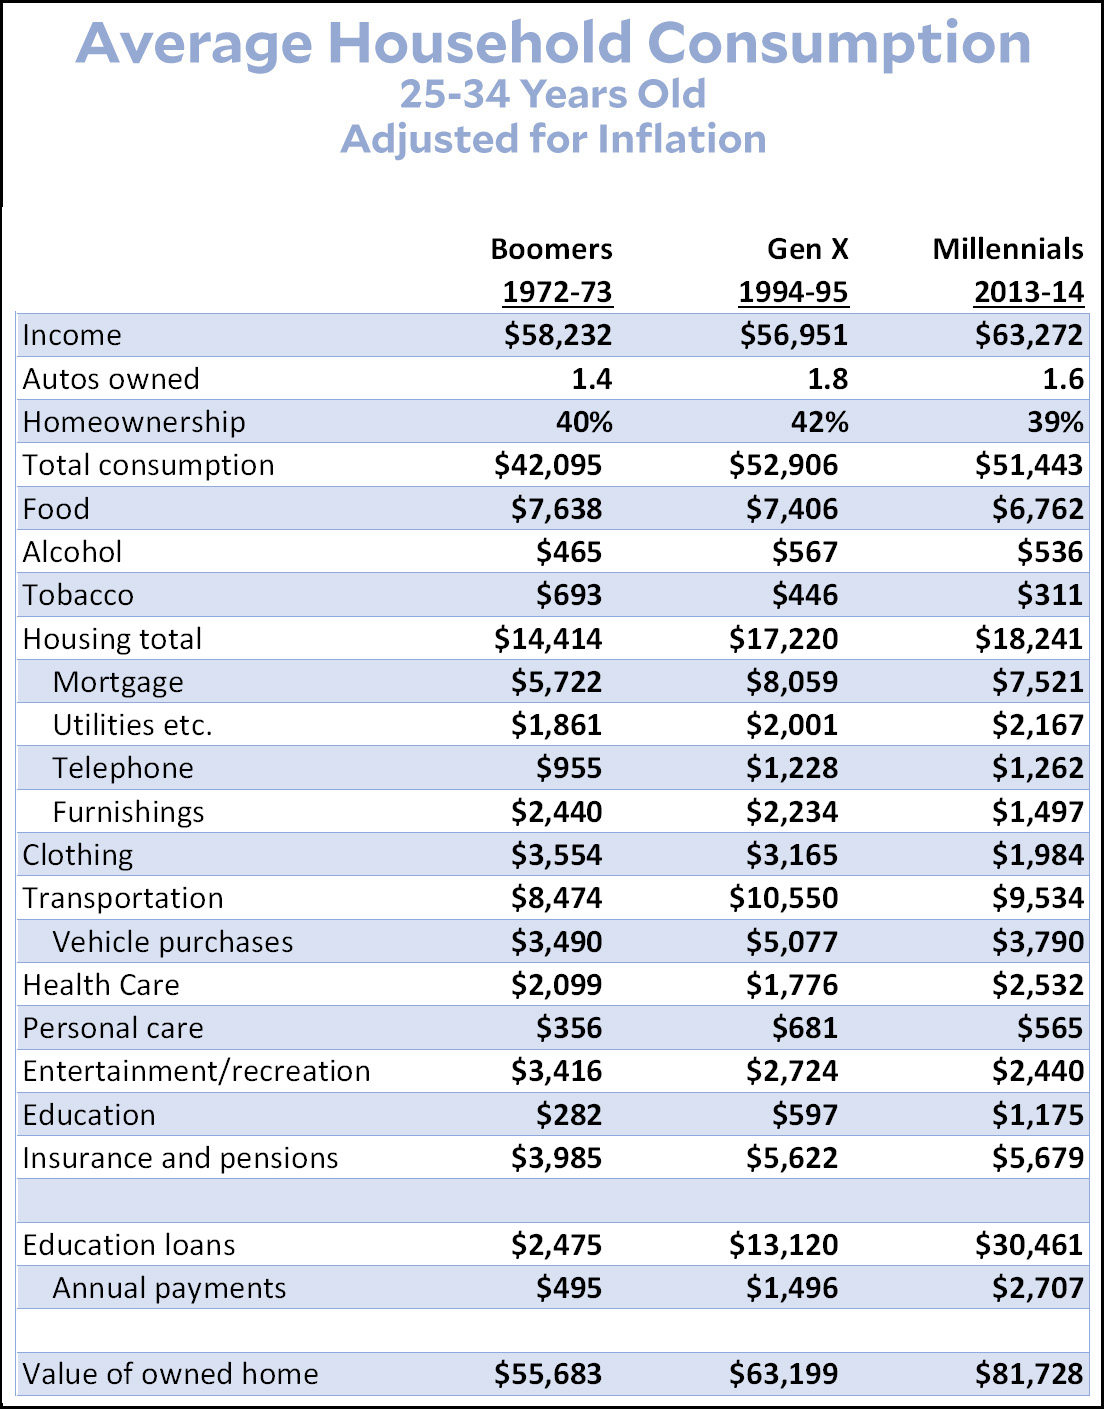
(NOTE: This table has been corrected and updated. It now shows income before taxes rather than income after taxes. Explanation here. The mortgage line has been corrected to show total mortgage payments, not just interest charges.)
There are a few interesting things to note:
- Income growth has been sluggish but not zero since 1972. Millennials make more money than either Xers or boomers. In addition, they pay lower taxes.
- Auto ownership among millennials is higher than boomers and a little lower than Xers.
- Both boomers and millennials spend about the same percentage of their incomes. Xers are the odd ones out here, spending mearly all of their income and owning homes at a slightly higher rate.
- That said, homeownership is similar for all three generations, and identical between millennials and boomers.
- I broke out telephone charges just because a lot of people might not realize that nothing much has changed on that front. Yes, we all own cell phones now, but back in 1972 we paid the equivalent of nearly $100 per month just for local calls on a normal landline plus a little bit of long distance calling.
- Millennials, on average, spend about $1,000 more per year on education loans compared to Xers, and about $2,000 more than boomers.
- Total housing costs have gone up about $4,000 per year since 1972. However, food, clothing, and entertainment cost significantly less.
- Health care spending hasn’t changed much.
Overall, young millennials face higher costs than young boomers did, but they also have higher incomes. When you add it all up, millennials have about the same amount of money left over at the end of the year as boomers, but they get quite a bit more for their spending (cell phones, computers, internet access, better cars, videogames, etc.).
As always, keep in mind that these figures are averages. So housing, for example, is an average of everyone from the poorest renter to the richest McMansion owner. Obviously things might be different for a very specific demographic (like, say, a 30-year-old college educated woman working at a nonprofit and living in New York City). But on average, the CES gives a pretty good idea of how different generations compare.
¹TECHNICAL NOTES: Choosing representative years is tricky. My main goal was to avoid cherry picking years that were peaks or troughs of economic cycles. This made the whole exercise difficult. I chose 1972-73 for the boomers because that’s what was available. They didn’t conduct the CES every year back then. For Gen X I chose 1994-95. This makes the Xers a little older than the boomers, but I wanted to avoid choosing a year close to the 1991 recession. Millennials posed a real problem. The ideal comparison year is around 2008, but that’s the peak of the housing bubble and wouldn’t be representative. Likewise, a few years later is in the trough of the Great Recession, which receded very slowly. In the end, I chose 2013-14 because it seemed like the earliest year that was solidly part of an economic expansion. This makes the millennials in the survey older than the other the other two generations, but I needed to avoid the Great Recession by several years to get a fair comparison. You can argue with my choices, but the key is that all of these years are fairly similar: several years into an economic expansion but not at the peak of a bubble (1999, for example, or 2008).
Also, by coincidence, 1972-73 is the peak year of postwar income growth. After that, income growth slumped and has been sluggish ever since. So we’re comparing recent generations to boomers in their best years.
Education loans come from the Fed’s Survey of Consumer Finances. For 1972-73 (before the SCF existed), I plugged in a rough estimate based on CES data. The annual payments are based on a 15-year repayment schedule using interest rates prevalent at the time.
For the inflation adjustment I used the CPI-U-RS, backed out from the Census Bureau’s historical income figures.