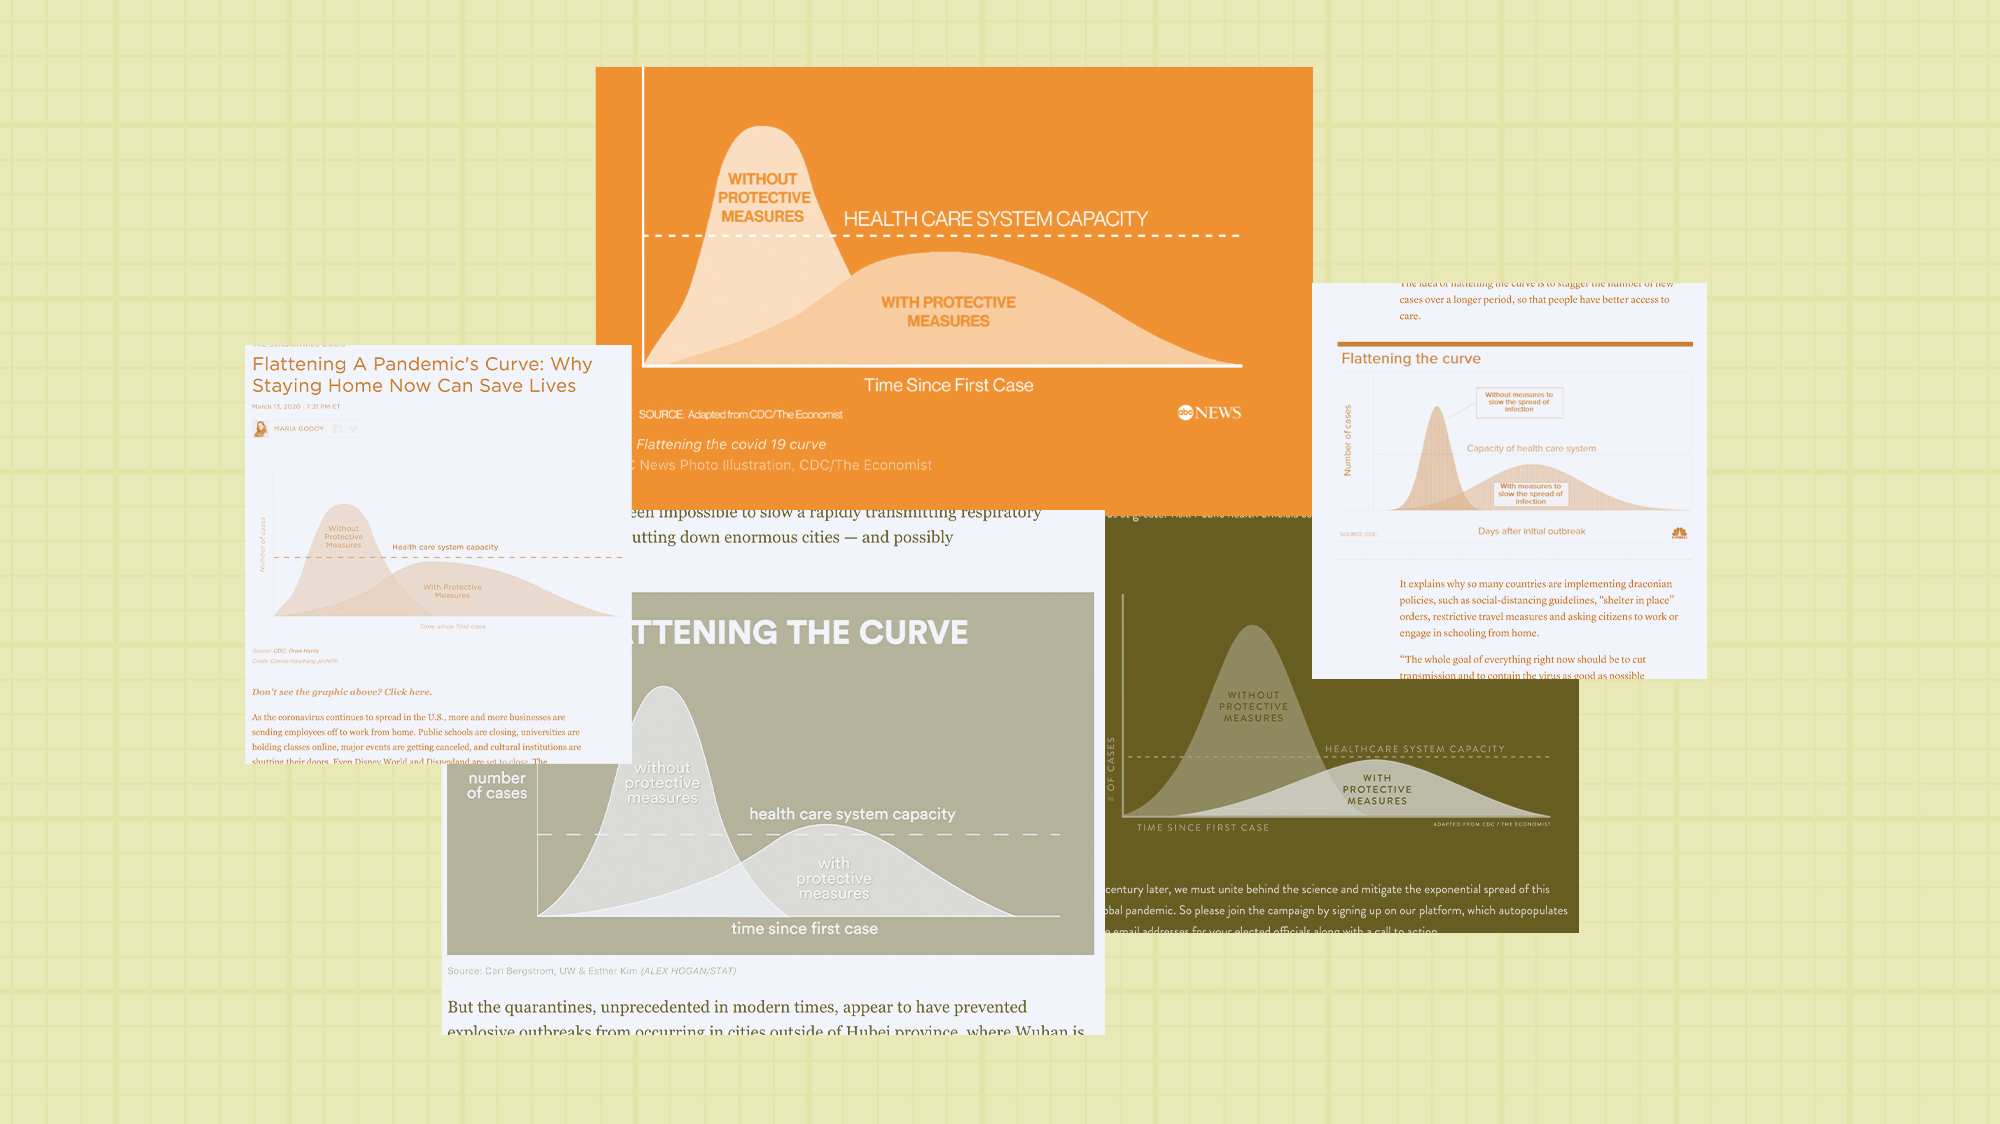
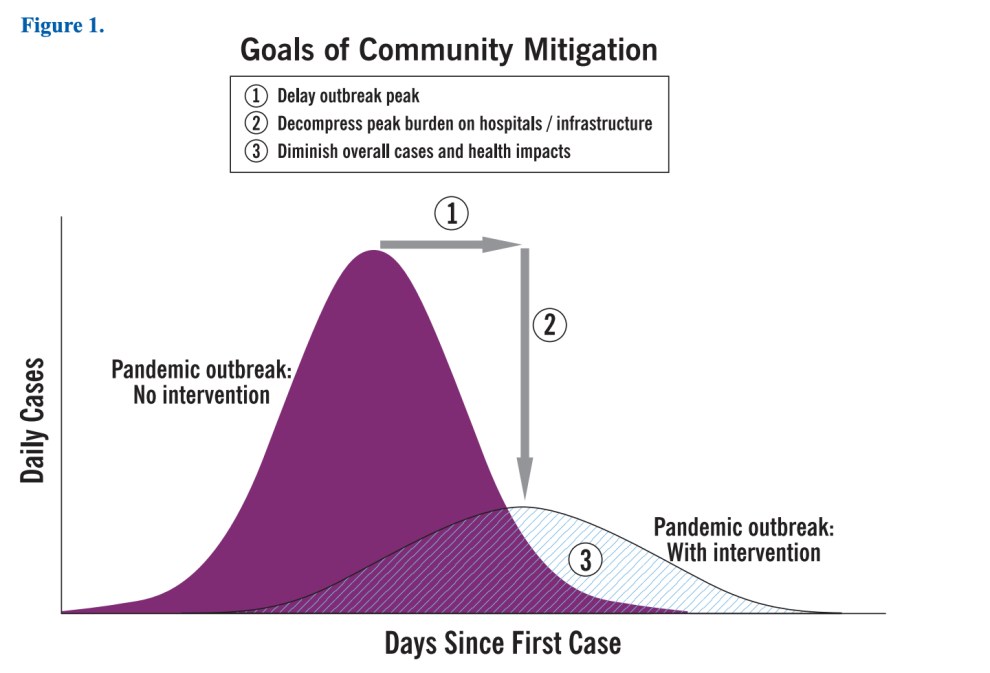
The first version of the now-ubiquitous “flatten the curve” chart appeared in a 2007 report by the Centers for Disease Control and Prevention. The image, titled “Goals of Community Mitigation,” accompanied a list of radical recommendations to swiftly change American life in the event of a pandemic: close schools, cancel public gatherings, recommend voluntary isolation. The authors used a now-familiar term for the strategy: “social distancing.”
The colors have changed, but the chart then was more or less what we see today. Two ugly humps: one purple and steep, representing the outcome of a pandemic in which no interventions are taken; the other hatched and flatter than the first, depicting the outcome under a community-mitigation regime.
CDC
There were axes and legends, and Drew Harris, a professor of population health, would later add a line representing the capacity of the health care system, but in truth there was nothing particularly rigorous about the chart. It was a work of the imagination, too artless to be art but lacking the hard empiricism we expect of science. That in-betweenness is what made it so effective.
Important to remember that #Covid-19 epidemic control measures may only delay cases, not prevent. However, this helps limit surge and gives hospitals time to prepare and manage. It's the difference between finding an ICU bed & ventilator or being treated in the parking lot tent. pic.twitter.com/VOyfBcLMus
— Drew A. Harris, DPM, MPH (@drewaharris) February 28, 2020
When public health crises emerge, the scientists tasked with helping people understand infectious threats need to overcome a huge perceptual obstacle: Pathogens can’t be seen by the naked eye. Since the advent of modern medicine, public health visualizations have been forced to find innovative ways to render invisible threats visible, and thus comprehensible.
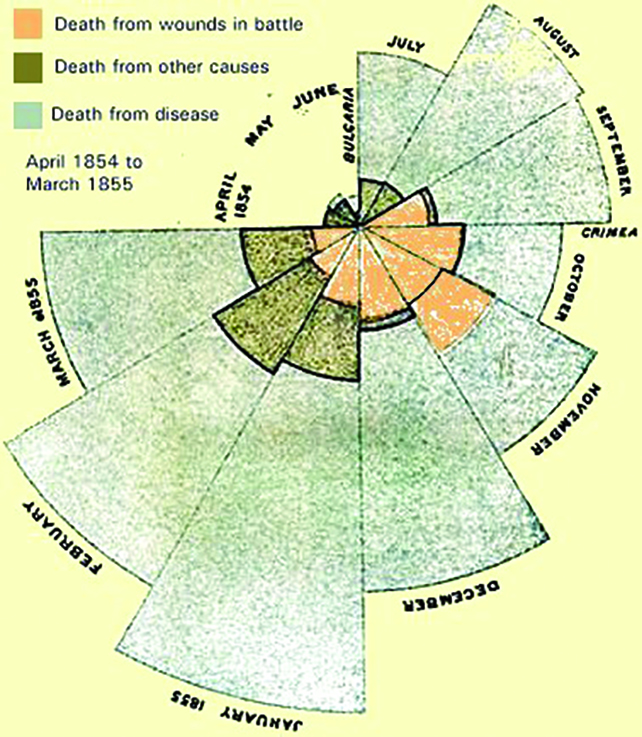
In 1858, pioneering statistician and social reformer Florence Nightingale used a unique rose diagram to show that the primary cause of death for British soldiers in the Crimean War wasn’t fatal wounds on the battlefield but disease due to unsanitary living conditions. In 1854, when cholera broke out in London and no one knew how the illness spread, Dr. John Snow’s map of the locations of cases in the Soho neighborhood showed that the illnesses were centered around a single water pump on Broad Street.
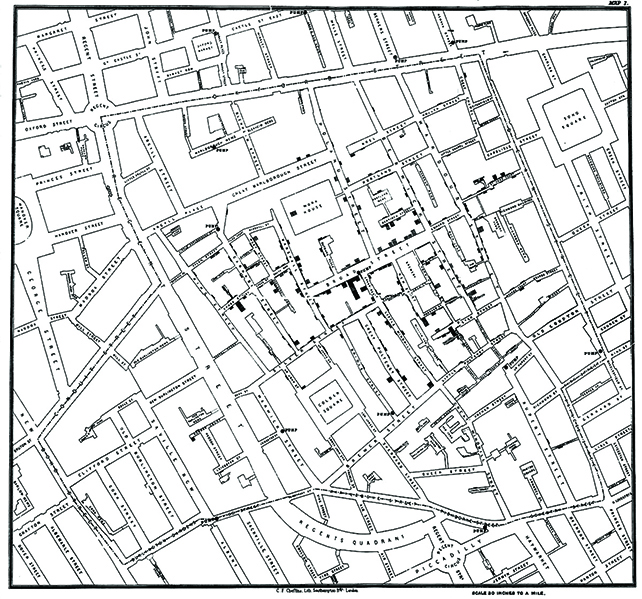
“The map is still a landmark in the history of epidemiology, cartography, public health, and data visualization,” Alberto Cairo, an expert in information design and the author of How Charts Lie, says. “Data visualization progresses in parallel to these disciplines, mainly because these disciplines need tools to analyze data or to persuade people of the reality of those data.” When people are dying of invisible ailments, pictures explain why.
The “flatten the curve” graph is doing something a little different from Nightingale’s and Snow’s visualizations. There are no actual numbers. Neither axis contains numerals. The x-axis is a general idea of time; the y-axis is a vague estimate of the number of cases. The line for health care capacity is rigid and dotted but inexact. The curves are entirely theoretical. Actual pandemic graphs don’t have perfect curves or clear narratives; they have bumps and anomalies along the way.
“Charts are not illustrations. Charts are arguments,” says Cairo. Real data, says Simon Rogers, data editor at Google and author of Facts Are Sacred, would have detracted from the simplicity of the graph’s message: The short hill was better than the tall hill. The axes lend an aura of scientific authority, but as with Nightingale’s and Snow’s images, the genius lies in the chart’s implicit promise that our fate is in our own hands.
One of the reasons for the graph’s staying power is that it appeals to certain universals of human perception. We’re hardwired to understand visual cues. The bright red of the steep curve grabs our attention and signals danger, while the gentle blue slope brings calm. Without protective measures, the curve is a mountain; with them, it’s a molehill, suggests Catherine Stones, a professor of graphic design at the University of Leeds who specializes in health communication. Then there’s the health care capacity line, a cordon stretched across our imagination. “We interpret that as a threshold: Don’t go beyond it,” Cairo says.
Like all good designs, this one doesn’t overwhelm the viewer with excessive information. It’s simple. “That’s what makes it so powerful,” Cairo says. “One curve versus another curve.”