Illustration by: John Hendrix
1 in 4 U.S. jobs pay less than a poverty-level income.
During the 1980s, 13% of Americans age 40 to 50 spent at least one year below the poverty line; by the 1990s, 36% did.
Since 2000, the number of Americans living below the poverty line at any one time has steadily risen. Now 13% of all Americans—37 million—are officially poor.
Among households worth less than $13,500, their average net worth in 2001 was $0. By 2004, it was down to –$1,400.
Bush’s tax cuts (extended until 2010) save those earning between $20,000 and $30,000 an average of $10 a year, while those earning $1 million are saved $42,700.
In 2002, Sen. Charles Grassley (R-Iowa) compared those who point out statistics such as the one above to Adolf Hitler.
Bush has dedicated $750 million to “healthy marriages” by diverting funds from social services, mostly child care.
Bush has proposed cutting housing programs for low-income people with disabilities by 50%.
Among the working poor, 13% of income is spent on commuting if public transportation is used, 21% if a private vehicle is used.
Workers who earn $45,000 or more spend 2% of their income on commuting.
2 in 3 new jobs are in the suburbs.
58% of Boston-area jobs suitable for welfare-to-work participants are within a mile of public transit.
76% of Boston welfare moms don’t own a car.
1 in 3 people who’ve left welfare since 1996 did so because they couldn’t meet program requirements or they hit the 5-year limit.
1 in 7 have no work, no spousal support, and no other government benefits.
46 million Americans are uninsured—a 15% increase since 2000.
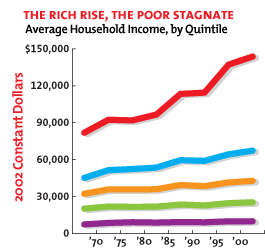 83% of those earning $75,000 or more work for companies that offer insurance, versus 24% of those who earn less than $25,000.
51% of the uninsured are $2,000 or more in medical debt. 16% owe at least $10,000.
In 1997, 3 out of 4 doctors provided some free or reduced-cost care. Now, 2 out of 3 do.
2 in 5 elderly live on less than $18,000 a year, including Social Security benefits.
Last fall, Minnesota firefighters let an elderly man’s mobile home burn down because he hadn’t paid a $25 “fire fee.”
600,000 high school students dropped out in 2004. If each had stayed in school for just one more year, the nation would have saved $41.8 billion in lifetime health care costs.
2/3 of the reported “shrinking” gap between white and black men’s wages is attributable to black men dropping out of the labor market altogether.
The true jobless rate of black men in their 20s without a high school diploma is 72%.
A prison record reduces a convict’s wages by about 15% and wage growth by 33%.
Since 1983, college tuition has risen 115%. The maximum Pell Grant for low- and moderate-income college students has risen only 19%.
52% of poor college-qualified students go to a 4-year college within 2 years of graduating. 83% of richer qualified students do.
The Consumer Price Index for urban dwellers is up 25% since the federal minimum wage was last raised.
Inner-city grocery stores sell milk for 43% more than suburban supermarkets.
80% of food stores in Brooklyn are bodegas. Only 1 in 3 sell low-fat milk or carry fruit.
Corn subsidies have helped the price of soda fall 30% since 1983. Meanwhile, the price of fruit has risen 50%.
Per capita, the nih spends $68 on diabetes, which disproportionately affects the poor, and $1,414 on Lyme disease, which is named after a suburb in Connecticut.
63% of federal housing subsidies go to households earning more than $77,000. 18% go to households earning less than $16,500.
Since 1976, the federal budget has doubled, while hud’s budget has declined by 65%.
Initially an anti-redlining effort, sub-prime mortgages have risen tenfold since 1994.
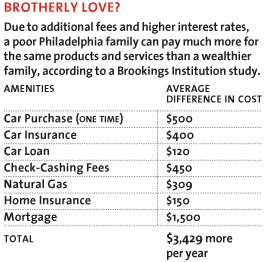 Today, 1 in 4 sub-prime lenders are predatory, charging recipients 7% in up-front fees. Conventional or “prime” mortgage users are charged only 1%.
2% of prime mortgages carry prepayment penalties. 80% of sub-prime ones do.
Since 1986, the number of pawnshops in the U.S. has increased by 142%.
13% of U.S. households don’t have a checking account. 1 in 10 don’t have any form of bank account.
In Chicago’s poorest areas, the ratio of check-cashing outlets to banks is 10-to-1.
Check-cashing fees for a worker who brings home $18,000 a year add up to about $450 —that’s 2.5% spent just to access income.
Nationwide, the number of payday lending outlets has risen 11,000% since 1990.
The average annual interest rate on a payday loan is more than 400%, costing borrowers $3.4 billion a year.
By claiming customers are “renting” goods, rent-to-own stores avoid usury laws that require businesses to disclose and cap interest rates—commonly over 300%.
America now has twice as many publicly available gambling devices that take money—slot and video poker machines and electronic lottery outlets—as it has atms that dispense it.
Credit card late fees are 194% higher than in 1994.
The average credit card balance for households earning less than $35,000 is $4,000.
At 11.5% apr, making the standard minimum payment of 2% per month, it takes 13 years to pay off a $4,000 balance.
In 2004, 7 million working poor families spent $900 million on tax prep and check-cashing fees to get their refunds sooner.
Average amount of time by which they sped up their refunds: 2 weeks.
1 in 7 families claim the Earned Income Tax Credit, designed to lift the working poor above the poverty line.
In 2003, the IRS estimated it “protected” $3.1 billion of revenue by cracking down on EITC filings. Half of all audits are now conducted on taxpayers earning less than $25,000.
41% of those making less than $30,000 think there is “a lot” of tension between the rich and the poor. Only 18% of those making $100,000 to $150,000 think this.

