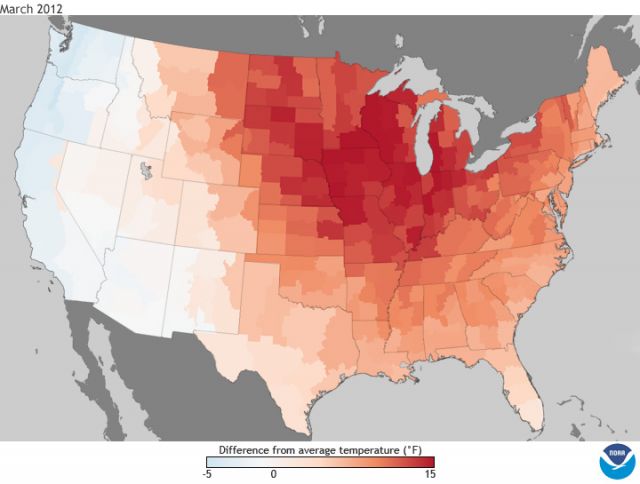
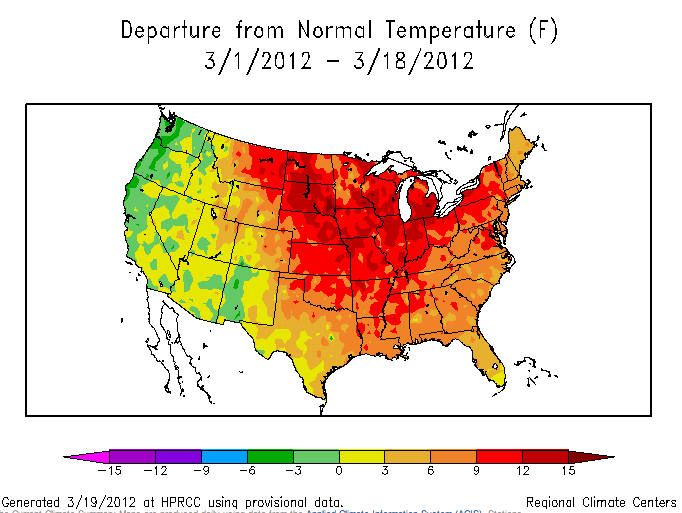
March 2012 temperatures—departure from average:
March was a whole new breed of insane for the record books according to NOAA’s State of the Climate report for the month.
First up, the mega tornado outbreak early in the month spawned 2012’s first billion-dollar disaster, as warmer-than-average conditions created a juicy environment for severe weather. There were 223 preliminary tornado reports in March, a month that averages 80 tornadoes. The majority occurred during the 2-3 March outbreak across the Ohio Valley and the Southeast. Forty people died and damages exceeded $1.5 billion.
Other March *highlights:*
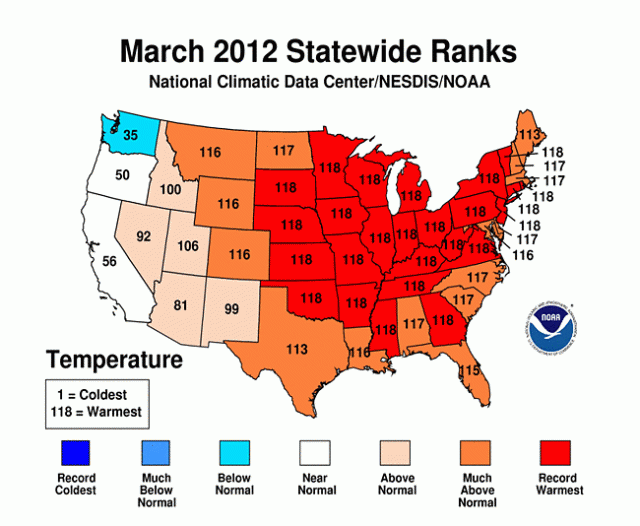
- It was the warmest March on record for the contiguous United States, a record that dates back to 1895.
- The average temperature of 51.1 degrees F was 8.6 degrees F above the 20th century average for March and 0.5 degrees F warmer than the previous warmest March in 1910.
- Of the more than 1,400 months that have passed since the U.S. record began, only one month, January 2006, saw a larger departure from its average temperature than March 2012.
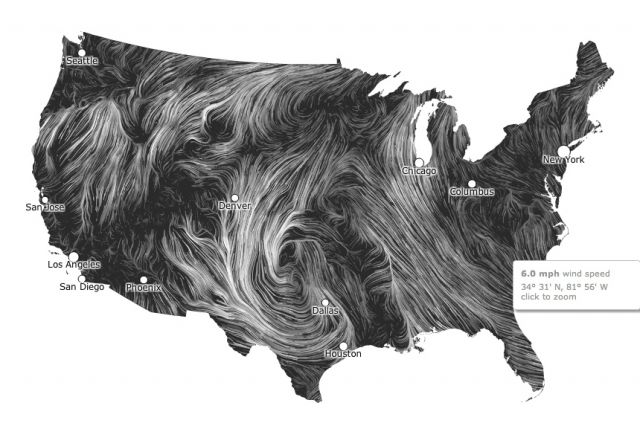
Surface wind flow for 21 March 2012. Click for animation: NOAA.
The March craziness was due to a persistent weather pattern that put a kink in the jet stream and kept cold away from the eastern two-thirds of the Lower 48. In the wind map above (click for amazing animation), you can see how this pattern formed a cut-off low: an atmospheric eddy, like an oxbow in a river, visible in the swirl of winds around Dallas.
Here’s how Martin Hoerling of NOAA’s Earth System Research Laboratory describes the results of that kinky pattern:
Nature’s exuberant smashing of daily high temperature records in recent weeks can only be described as “Meteorological March Madness”. Conditions more fitting of June than March prevailed east of the Rocky Mountains since the start of the month. The numbers are stunning. Take, for example, the nine consecutive record high temperatures in Chicago from 14-22 March, eight of which saw the mercury eclipse 80°F. For those unfamiliar with the area’s climatology, high temperatures do not normally begin exceeding 80°F until after commencement of the Summer solstice. NOAA’s National Climate Data Center reported that over 7000 daily record high temperatures were broken over the U.S. from 1 March thru 27 March. With beachgoers flocking to the balmy shores of Hampton Beach, New Hampshire this week, one wonders if a new normal is emerging for the preferred destination of Spring-break revelers.
NOAA National Climatic Data Center
The same pattern brought cooler-than-average conditions to the West Coast states of Washington, Oregon, and California. Nevertheless:
- Every state in the nation experienced a record warm daily temperature during March.
- Preliminary data show 15,272 warm temperature records broken (7,755 daytime records, 7,517 nighttime records).
- Hundreds of locations across the country broke their all-time March records.
- There were an unbelievable 21 instances of nighttime temperatures being as warm, or warmer, than the existing record daytime temperature for that date.
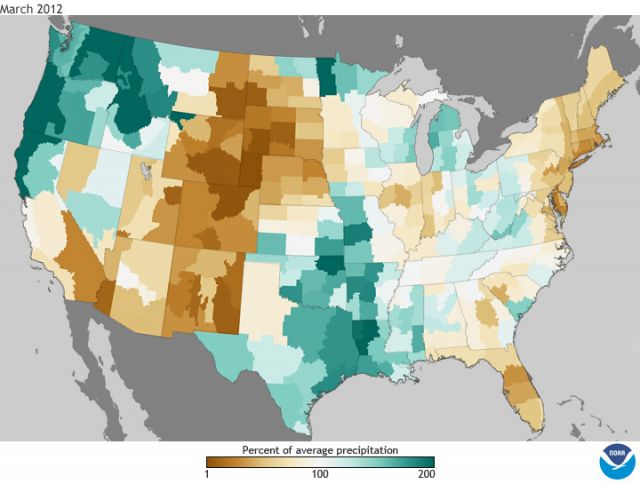
March precipitation departures from 1981-2010 average: NOAA
It wasn’t only about temperature either. Precipitation was anomalous throughout much of the country too, as you can see in the map above… really wet or really dry compared to the 1981-2010 average, with not a whole lot in between.
In fact the entirety of the so-called cold season that spanned October 2011 to March 2012 was whack. According to NOAA’s US Climate Extremes Index (USCEI)—which tracks the highest and lowest 10 percent of extremes in temperature, precipitation, drought, and tropical cyclones across the contiguous US—38 percent of the contiguous US racked up the second highest USCEI rank on record:
- A record 100 percent of the Northeast and Upper Midwest regions were walloped by extremes in both warm maximum and warm minimum temperatures.
- Between 90 and 100 percent of the Ohio Valley and the Southeast experience record extreme temperatures between October 2011 and March 2102.
