What if Clinton and Trump's key supporters didn't vote at all?Mother Jones
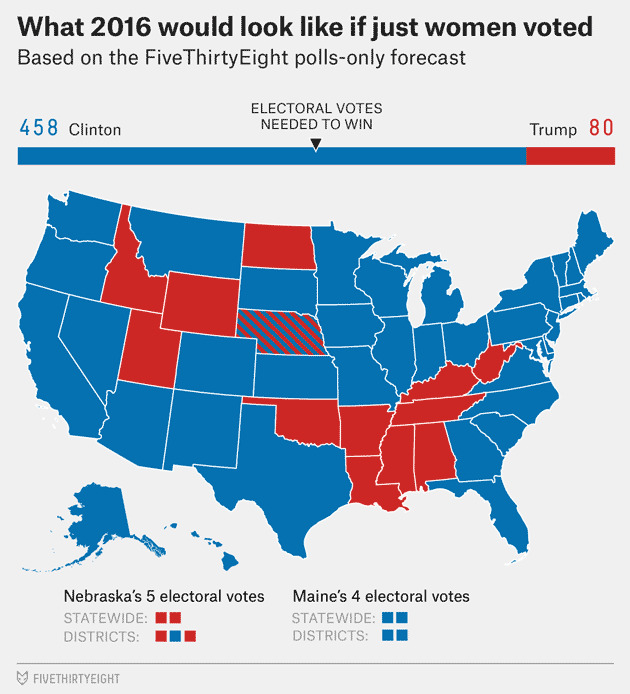
Three weeks ago, FiveThirtyEight’s Nate Silver made a hypothetical map of what would happen if only women voted for president on November 8. The results were strikingly lopsided: Hillary Clinton would trounce Donald Trump, 458 electoral votes to 80.
After that map (right) went viral, Trump fans rushed to reinforce his resistibility to most women by tweeting the hashtag #Repealthe19th (as in the 19th Amendment, which gave women the right to vote). Another Silver map, showing that a male-only electorate would elect Trump in a landslide, confused Eric Trump, who blasted it to his dad’s supporters, proclaiming, “Right now all the momentum is on our side.” These maps also sparked a slew of “What if only ____ voted” joke maps.
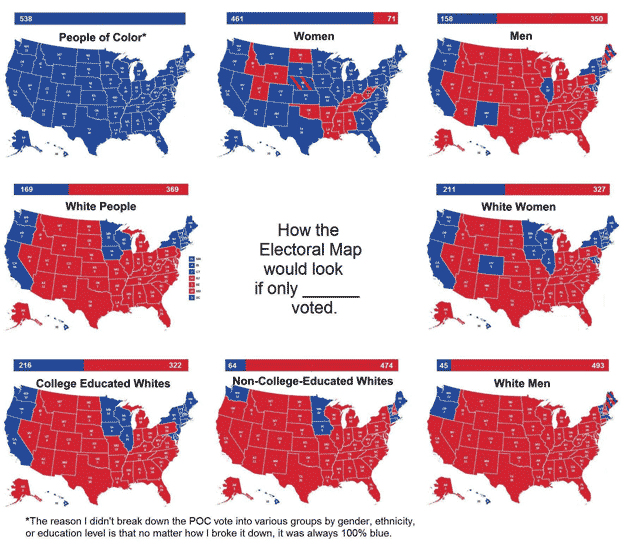
Yet Silver’s gendered election maps also inspired a set of maps (right) that further broke down various electoral scenarios by demographic group, which was shared widely.
While there were some initial questions about their origins and sourcing, the maps’ creator, Ste Kinney-Fields, came forward and revealed that her data came from FiveThirtyEight’s Swing-O-Matic. That’s a nifty tool that lets users generate presidential election outcomes by tweaking the political preferences and voter turnout among different demographic groups.
These maps highlight just how essential demographics are for each candidate’s path to the White House. Clinton cannot win without the votes of women and people of color, and conversely, Trump cannot win without men and white people. But these maps’ emphasis on winner-take-all electoral math obscures the depth and variance of the candidates’ support among key demographic groups. Silver’s map of women’s votes assumes that because Clinton is beating Trump by 10 percentage points nationally, a women-only election would boost her performance by 10 points in every state. And the viral maps based on the Swing-O-Matic uses 2012 election data to predict voter preferences and turnout rates.
For more current, state-level numbers on how various demographic groups might vote, I pulled data from YouGov, whose election model is based on more than 46,000 recent interviews with potential voters. Using its data, I generated a series of “What if only ____ voted” maps to show which states the candidates would win, and by how much. (They’re based on YouGov’s October 22 data.)
What if only women voted?
Let’s start with women. In Silver’s map, women would hand Clinton 458 electoral votes. (A candidate needs 270 to win.) In the map below, based on the YouGov data, Clinton still has a lock on 330 electoral votes. (Texas and South Carolina were too close to tell, but they would probably go to Trump.) In all 50 states, she gets more support from women than men, but her level of support among women varies widely. Their support for Clinton ranges from a high of 86 percent in Washington, DC, to a low of 30 percent in Utah. In New York and California, she’d win by more than 30 points. But in Wyoming and West Virginia, she’d lose by more than 20 points.
What if only men voted?
Relying just on men, Trump would easily win with 338 electoral votes. Overall, Trump has a consistent advantage among men, ranging from 2 points (Delaware) to 10 points (Montana). Men’s support for Trump ranges from a high of 61 percent in West Virginia and Wyoming to a low of 12 percent in Washington, DC. The map below is a bit bluer than Silver’s: Clinton could win over dudes by a small margin in Virginia.
What if only white people voted?
Trump’s strong support from white voters is no secret. If only they voted, he’d win handily. Here, the YouGov data is similar to the FiveThirtyEight data. It shows the depth of support that Trump enjoys among white people, especially in the South, where Clinton trails by 40 points or more in every state from Texas to South Carolina. And in most otherwise blue states, Trump and Clinton are within several points of each other.
YouGov doesn’t provide state-level data for white men, white women, or white people by education level. However, by plugging its national-level data into the Swing-O-Matic, we can compare how various categories of white people would affect the election according to the FiveThirtyEight model and the YouGov model. (One big difference between the two data sets is that FiveThirtyEight’s assumes 2 percent of the vote is going to third-party candidates; YouGov’s shows 9 percent of the white vote going to third-party candidates.)
The YouGov data for white people overall generates a pretty bleak electoral scenario for Clinton. However, its data for white women and college-educated whites looks much better for her. If either of these groups voted alone, Clinton would eke out a victory with 280 electoral votes.
What if only black people voted?
Electoral maps don’t get any bluer than this. African Americans support Clinton by huge margins. Only in Idaho does her support dip below 80 percent of black respondents—to a still-respectable 74 percent. Even though there’s no data for superwhite Montana, it’s highly likely that its small black population backs Clinton—creating a scenario in which she’d pick up all 538 electoral votes. (So far, Trump’s Twitter followers haven’t suggested #Repealthe15th.)
What if only Hispanics and Latinos voted?
Clinton also would enjoy a monumental landslide if only Hispanics and Latinos voted. However, her support among this key constituency dips in the Deep South: In Mississippi, 47 percent of Hispanics prefer Clinton, while 42 percent support Trump.
What if only 18- to 29-year-olds voted?
The viral “What if” maps didn’t look at age, but YouGov’s data does include age cohorts. Young voters are another important Clinton base: If only millennials voted, they’d overwhelmingly vote to make her America’s second-oldest president ever. However, her support among the young and youngish varies widely by state. In otherwise red states like Idaho, Wyoming, and South Dakota, significant chunks of these voters say they’re supporting third-party candidates Gary Johnson or Jill Stein. The real question about this voting bloc is: How many of them will show up to vote? About half of eligible 18- to 29-year-olds voted in 2012.
What if only people 65 or older voted?
On the flip side, America’s oldest voters would elect fellow Baby Boomer Donald Trump. Clinton would still hang on in coastal blue states but would still lose to a candidate who says he feels 35. And this group doesn’t slack on Election Day: About 72 percent of voters 65 or older cast ballots in 2012, one of the highest turnout rates for any demographic group.
While these maps are a fun way to generate poli-sci-fi scenarios, they’re still a useful tool for exploring the demographic coalitions Clinton and Trump need to win.
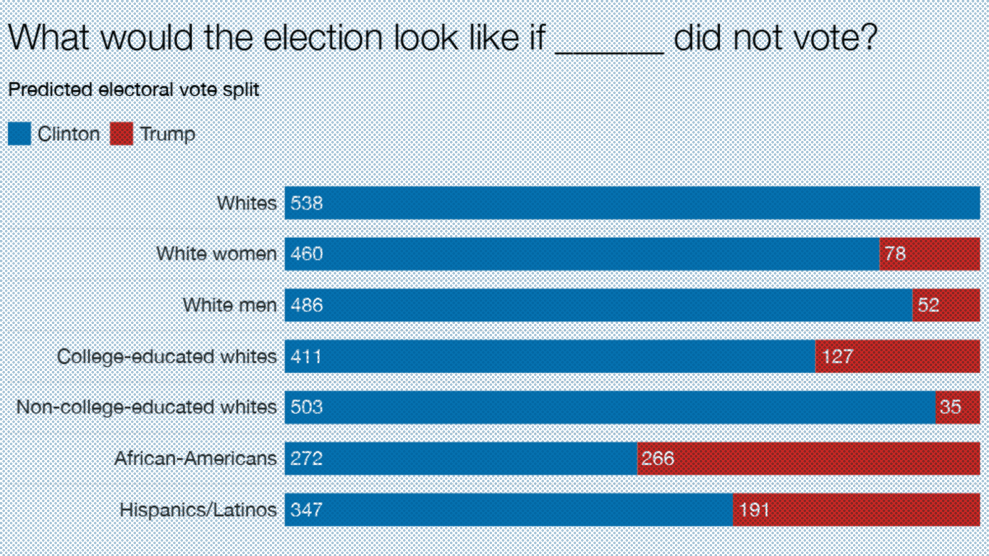
Or here’s another way to look at the data: Could Clinton and Trump win if any one of their major demographic bases didn’t show up to vote? If white voters or any subgroup of white voters didn’t vote, Trump would lose. If Hispanic voters didn’t vote, Clinton would still be safe. But if black voters went AWOL, she’d be cutting it uncomfortably close. If Clinton does win next Tuesday, she’ll probably thank all Americans for their support. But she should really thank women, people of color, and younger voters.

