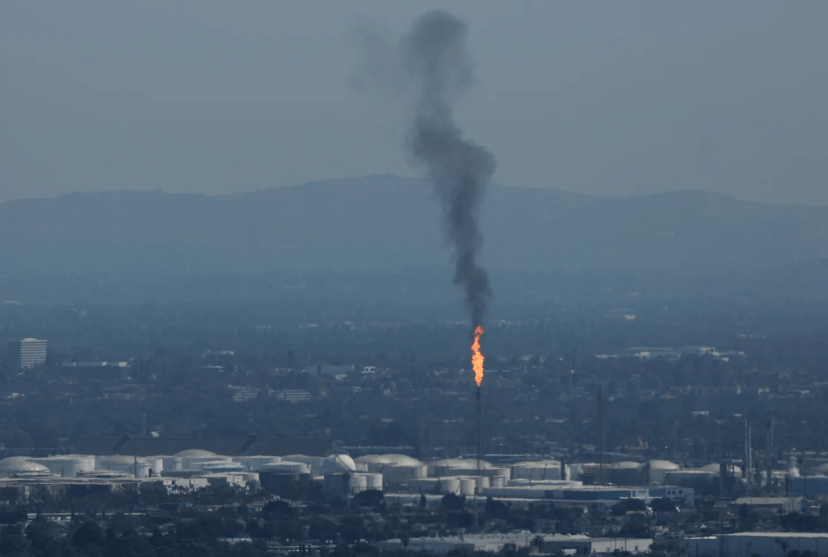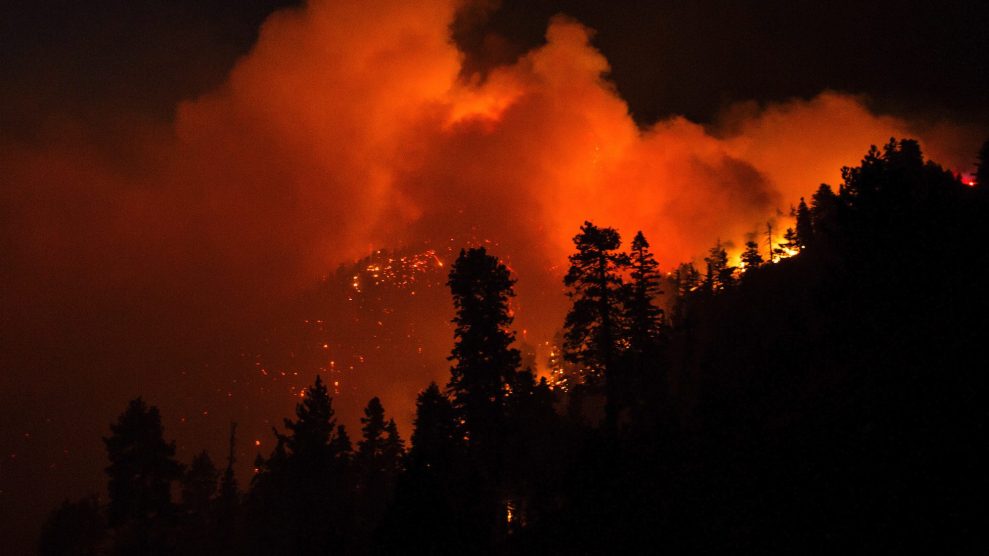
The Bobcat Fire burns in the Angeles National Forest in Los Angeles, Monday, Sept. 21, 2020.Ringo Chiu/Zuma
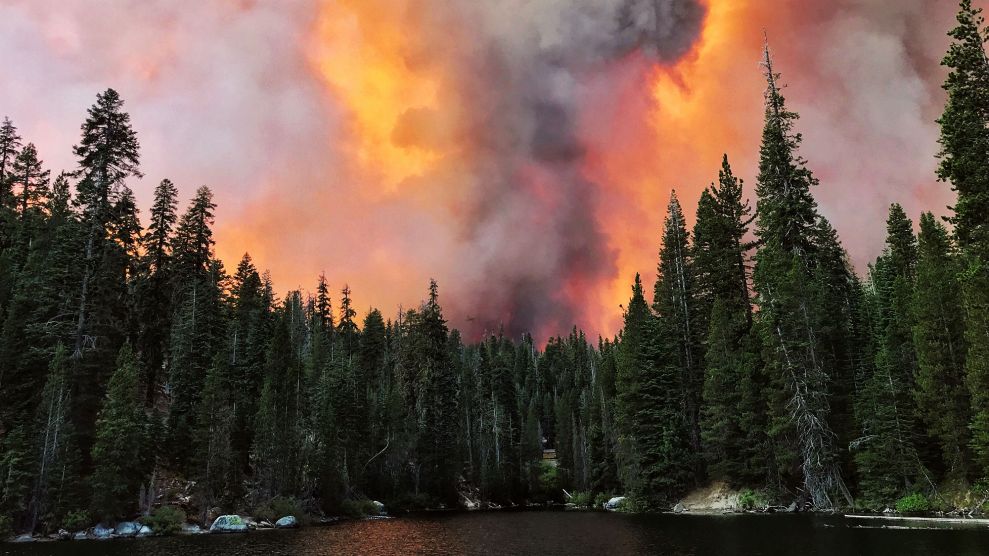
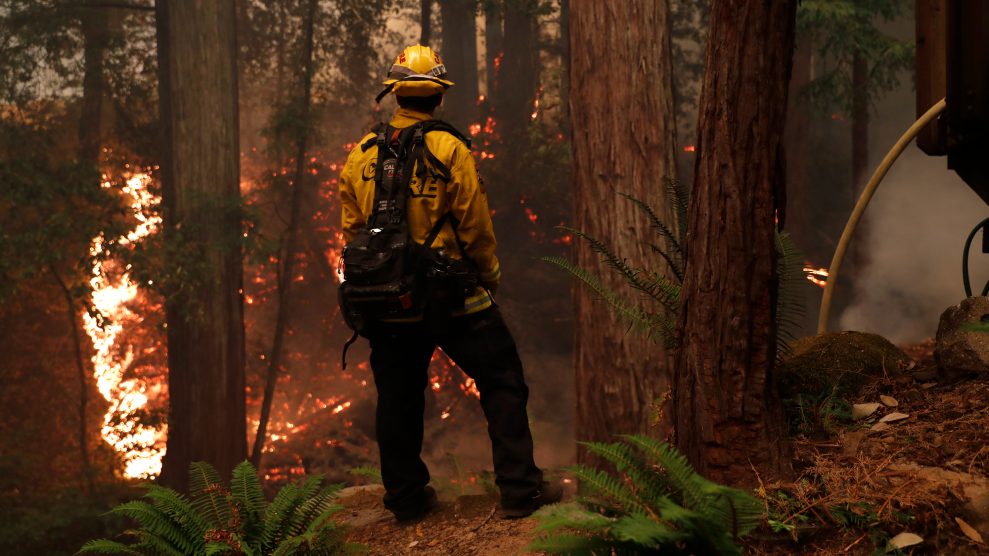
In mid-August, the most destructive wildfire season in California history seemed to peak over a deadly 48-hour period. Between the evenings of August 16 and August 18, five of the 20 largest ever fires began to spread across the state. With the addition of the Creek Fire two weeks later, six record-breaking infernos were spreading simultaneously. At varying degrees of containment, they still are.
With the wildfire season only half over, it is difficult to tally all the damage. Last year, the fire season was one 26th the size 2020’s, and there are months left before this season ends. How is it possible to comprehend the difference between, say, 10,000 scorched acres and one million? To put this year’s wildfire season thus far into perspective, here are five stats to contextualize the damage.
Area Burned
This year, Cal Fire reports that about 3.6 million acres have burned. That’s equivalent 5,667 square miles. The 14 most-populated US cities combined—including New York, Los Angeles, Chicago, Houston and Philadelphia—encompass 5,666 square miles and are home to more than 27 million people.
Fire Fuel
During a press conference earlier this month, Donald Trump revived a bizarre claim he made in 2018 about Europeans being better at preventing wildfires because they rake forest floors. On its own, the claim reflects a deep misunderstanding of wildfires, but plugged into a Trump-to-English translator, there might be something there. The president is a fan of more aggressive forest management, including clearing out dead trees that could fuel flames. In addition to—and because of—climate change, some California forests have seen massive tree die outs in recent years due to hungry bugs, leaving an excess of dry, flammable material. As Mother Jones reporter Jackie Flynn Mogensen recently noted, “The massive tree death during those years was primarily due to the 2012-2015 drought and decades of forest mismanagement that resulted in severe overcrowding…one other key factor was an extensive bark beetle infestation.”
As a result, the USDA estimates that more than 150 million trees died across the state in the last decade. This is particularly concerning in Sierra National Forest, where the Creek Fire is burning. So what does this mean? Officials estimate the die outs created 2,000 tons of fire fuel per acre there, which means that burnable material equivalent in weight to four fully-stocked Boeing 747 commercial jets sits on every acre of a plot of land the size of a large backyard.
Smoke Emissions
The August ramp up of flames translated to an increase of smoke emissions into the atmosphere. On August 12, for example, before fires gained in intensity, there were 365 metric tons of smoke emitted across California, according to three researchers, Dr. Fangjun Li and Dr. Xiaoyang Zhang at South Dakota State University, and Shobha Kondragunta at the National Oceanic and Atmospheric Administration. In less than a month, on September 8 when fires were spreading rapidly, the daily emissions spiked to 1,057,348 metric tons. All told, the wildfire smoke emissions between August 12 and September 22 add up to about five million tons. To put that into perspective, an average gas powered car emits around 4.6 metric tons of carbon dioxide annually. Carbon dioxide and smoke particle emissions are distinct from each other, but in sheer mass, California’s wildfires released in six weeks what more than one million cars would release in a year, if each drove 11,500 miles in that period.
Air Quality
Recently, signs of the unusual fire season spread beyond the West with wildfire smoke coulding skies in the east coast. One smoke plume even streaked across the Atlantic Ocean, and appeared above the Netherlands.
Back in California and Oregon, air quality continued to worsen as toxins released from the fire, like particulate matter 2.5—a tiny, invisible but dangerous substance—spread throughout the air. Once inhaled, PM2.5 can cause lung inflammation, spark flare ups for those with preexisting lung conditions, and likely worsen COVID-19 symptoms. According to the Los Angeles Times, 95 percent of Californians were being exposed to bad air quality by mid-September. Between September 14 and 17, the top five worst ever air qualities readings in the state took place. At the top of the list was the September 15 reading for Mammoth Lake in the Sierra Nevada Mountains. At 660 micrograms of PM2.5 per cubic meter, the town was experiencing levels almost 20 times worse than the EPA’s maximum single day safe exposure of 35 micrograms.
Financial Cost
It’s impossible to predict how much financial damage this wildfire season will incur. With so much to tally, it’s doubtful the number will ever be certain. Some costs are clear: property destroyed, lives lost, work disrupted. But as the fire-caused disruptions ripple out across the lives of Californians, things become less defined. Calculating the costs of the lung damage caused across the state, for example, may be impossible. A Scripps Institute of Oceanography researcher, Tom Corringham, told the New York Times it “wouldn’t surprise me if the damages are over $20 billion this year.” How much is that equivalent to? Approximately one-third of the US film industry—or the entire economy of Bosnia and Herzegovina.

